Diving Into the Data: Minnesotans Going All-In on Electric Vehicles
December 16, 2019 | Elizabeth Abramson and Jessi Wyatt | Education
Electric vehicle (EV) deployment is ramping up across Minnesota. New data from 2019 (which you can explore in a previous blog post) shows that EV deployment hit new records throughout the state. Between 2018 and 2019 alone, the number of EV registrations in Minnesota has almost doubled. With declining vehicle costs, expanding EV infrastructure, and growing consumer preference for climate-friendly products, EV growth in Minnesota shows no signs of slowing down. The statewide EV map further helps spotlight that EVs are not only a phenomenon in urban areas. In fact, there is only one county of the 87 in the state that does not have at least one EV registered.
Diving into the Data
Using data from the Minnesota Department of Public Safety, the Minnesota Department of Motor Vehicles, and the Minnesota Pollution Control Agency, Great Plains Institute (GPI) staff are uncovering supplementary insights into EV ownership trends and patterns across Minnesota. The data shows some exciting trends for the uptake of EVs in the state.
Figure 1 shows EV growth in the past year, separated by plug-in hybrid electric vehicles (PHEVs) and battery electric vehicles (BEVs). Both PHEVs and BEVs are within the general category of plug-in electric vehicles (PEVs). PHEVs have both an electric motor and an internal combustion engine and can be charged by plugging into an external source of electrical power. After traveling a certain distance, a PHEV’s gas/fuel engine kicks in to assist in powering the vehicle. BEVs have no fuel-powered engine—they are powered exclusively by electric batteries that are charged by plugging into an outlet or charging station.
Figure 1. Growth in EV registrations in Minnesota by vehicle type (plug-in hybrid and battery) for 2018 and 2019
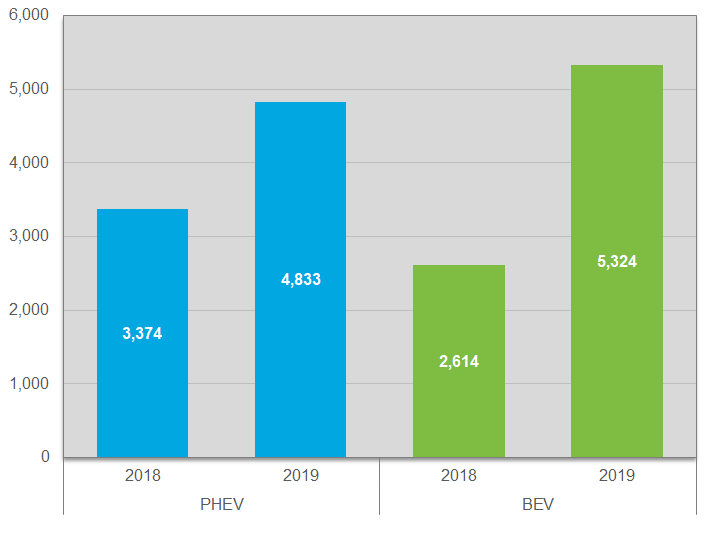
Source: All data for the graphs above was provided by the Minnesota Pollution Control Agency and Minnesota Department of Public safety. Data for 2018 was current as of January 1, 2018. Data for 2019 was current as of March 5, 2019. Figure authored by Elizabeth Abramson, GPI, 2019.
From 2018 to 2019, the total number of registered EVs in Minnesota rose from 5,988 to 10,157. Much of this overall growth can be attributed to a surge in BEV registrations, which nearly doubled between 2018 and 2019. BEVs now surpass PHEVs in popularity in Minnesota. However, it’s important to note that the PHEV category does not include more common conventional hybrid vehicles, such as the Toyota Prius, which use regenerative breaking to charge their battery rather than plugging into an external power source like a PHEV or BEV would.
As more EV models become available, Minnesotans have access to a greater variety of options and features than before, and consumers are proving with their purchases that BEVs can deliver on all their vehicle needs. Figure 2 shows the increase in models available for purchase in Minnesota between 2016 and 2019.
Figure 2. Number of plug-in electric vehicle models available in Minnesota by year
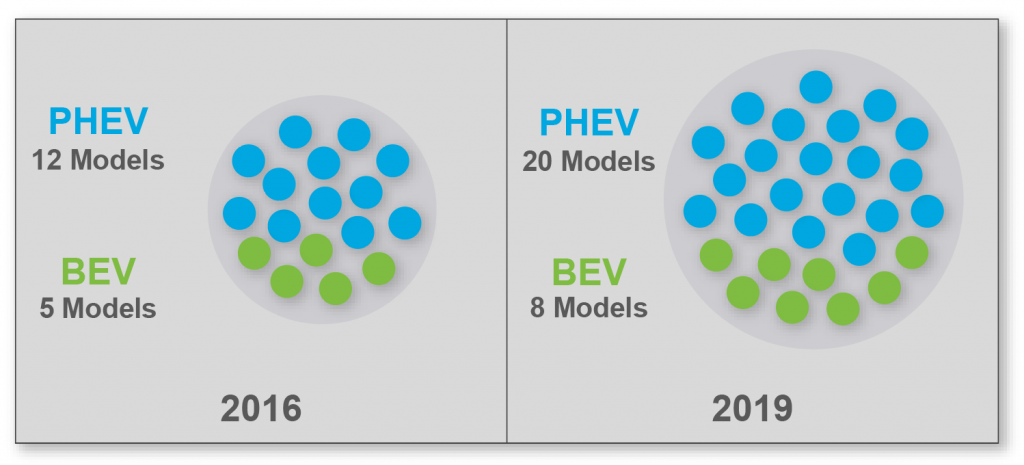
Source: Data was gathered through PlugIn Connect annual release of EV model availability. Figure authored by Jessi Wyatt & Elizabeth Abramson, GPI, 2019
The number of PHEVs available nearly doubled between 2016 and 2019, while the number of BEV models available increased by three. In total, Minnesota saw an increase in PEV options for consumers of eleven total vehicles.
Figure 3 shows the top 10 vehicle types in Minnesota by number of registrations as of March 5, 2019. While the most popular EV model is still a plug-in hybrid (the Chevy Volt, with 1,914 registered), the next three most popular EVs are fully battery-powered. These numbers may reflect increasing confidence in BEVs, as work continues to dispel common EV regarding limited range or winter performance. It may also allude to the gradually increasing availability of BEV models sold in Minnesota.
This trend broadly aligns with PEV vehicle popularity across the United States, where Chevrolet, Tesla, Nissan, and Toyota reign most popular. As more vehicle models and types become available in the state, there may be new shifts in model popularity—as well as an increase in the total number of vehicles.
Figure 3. Top 10 most popular EVs by vehicle make and model as of March 5, 2019
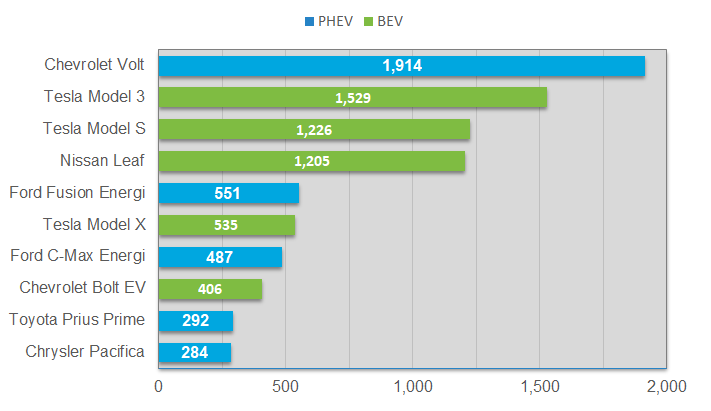
Source: Data from the Minnesota Department of Public Safety and Minnesota Department of Motor Vehicles. Figure authored by Elizabeth Abramson, GPI, 2019.
This shift in increasing consumer preference for battery electric vehicles (BEVs) is particularly interesting when cost is considered. On average, the average manufacturer suggested retail price (MSRP) of PEVs declined between 2016 and 2019, but that decrease was motivated by PHEVs, not BEVs. Table 1 outlines the difference in average MSRP across years.
Table 1. Change in average manufacturer retail price for PEVs (2016 and 2019)
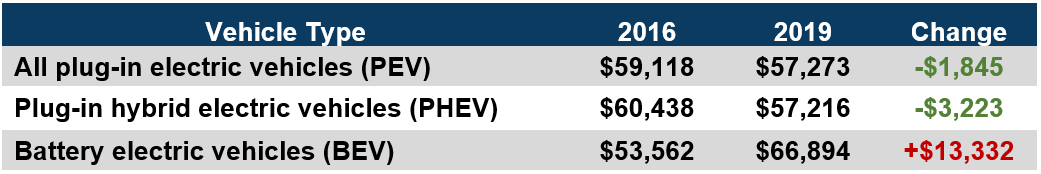
Source: Data gathered from PlugIn Connect annual EV model inventory. Note: All values presented are in 2019 $USD.
While MSRP is not necessarily an accurate representation of what a customer would pay to purchase a PEV—as financial programs and incentives vary by state and vehicle type—it does give some insight into a trend towards increasing willingness to pay even slightly more for a fully BEV. This is made more interesting by looking at the geographic distribution of BEV registrations.
BEV registrations increased at nearly even rates in the Twin Cities metro area and non-metro area between 2018 and 2019. BEV registrations more than doubled within the 7-county metro area, rising from 2,222 to 4,594 registrations, and nearly doubled outside of the metro area as well, rising from 384 to 725 registrations. This suggests that consumer preference for BEVs is growing rapidly in communities throughout Minnesota and that a strong network of EV charging infrastructure is essential far beyond the 7-county metro area.
BEV Registrations by Zip Code
Figure 4. Map of Battery Electric Vehicle (BEV) growth by Zip Code between January 1, 2018 and March 5th, 2019. Data from Minnesota Department of Public Safety and Department of Motor Vehicles. Image authored by Elizabeth Abramson, GPI, 2019.
Despite a two-fold increase in EV registrations from 2018 to 2019, EVs still only comprise 0.2 percent of the state’s 5.37 million vehicle passenger fleet. Increasing access to EV models, education and information on vehicle specifications, and investment in EV charging infrastructure (especially public charging infrastructure) are paramount to help continue to increase EV penetration on the road.
Conclusion
Understanding trends in EV registrations is vital to helping local and state government make informed decisions about things like EV charging infrastructure and even policies on vehicle emissions. For example, taking stock of increasing consumer interest in BEVs can inform discussions about Clean Cars Minnesota, a recently announced rulemaking on Low- and Zero-Emission Vehicle standards.
First announced in November 2019 by Minnesota’s Governor Walz, the Clean Cars rulemaking explores options for adopting the Low-Emission Vehicle Standard (LEV) and the Zero-Emission Vehicle Standard (ZEV) that are outlined in the federal Clean Air Act. Under federal law, states can elect to adopt California’s stricter requirements for what types of vehicles are available for purchase in the state.
Knowing where EVs are throughout the state, what trends have shown in the past, and the types of EVs is a key part of informing discussions on the Clean Cars policy. As Minnesota continues to explore reductions in transportation emissions and increasing electrification, understanding the data is a necessary first step.
If you’re interested in EVs, sign up for the Drive Electric MN quarterly newsletter, and stay tuned for a follow up post that describes additional insights regarding EVs and electric vehicle supply equipment data.
Share this post